
All about El Niño
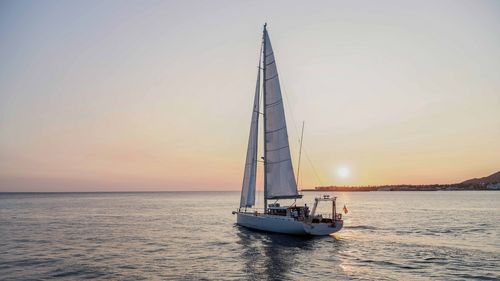
It’s often a question of being at the right place at the right time. That was the case last year for the team aboard the research yacht Eugen Seibold: while collecting samples from the Pacific, they were also able to gather comprehensive data on the global climate phenomena El Niño and La Niña—a world first.
It’s not only baby Jesus who makes an appearance around the end of December. Every two to seven years, the climate phenomenon El Niño also arrives, and it comes bearing a gift that nobody really wants: heat. Water and land temperatures at the equator rise significantly and, for about six months, the air and ocean currents between South America and Southeast Asia are altered, preventing cold deep-water in the eastern Pacific from rising. El Niño has devastating effects across the globe, causing drought, flooding, hurricanes and species extinction.
Although hot El Niño and his cold counterpart La Niña are recurring natural weather phenomena that have been documented for at least four hundred and fifty years, scientists know very little about what exactly happens in the Pacific during these major oceanic-atmospheric events. But now, thanks to the data col-lected by the team on the WSS-funded research yacht Eugen Seibold, El Niño and La Niña can be studied in detail for the first time.
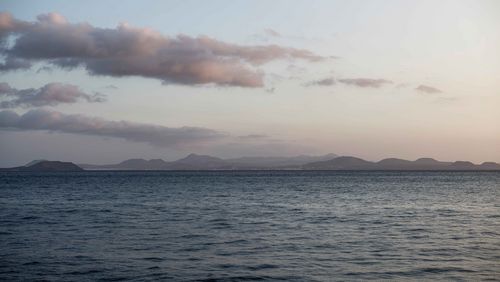
In spring 2023, the Eugen Seibold relocated to the harbour in Panama City and the research team began sampling the eastern Pacific in their neutral pre-El-Niño state. Then, at the end of 2023, El Niño arrived in full force. “When we were at sea in December, the water was so warm that the Seibold’s air conditioning system for cooling the samples nearly broke down,” says Gerald Haug, climate geochemist and “father” of the sailing research vessel. Despite the difficulties, the team managed to sample the critical equatorial marine regions between Panama and the Galapagos Islands.
In addition to measuring the rise in water temperature, the researchers also spent months continuously monitoring the key physical, chemical and biological parameters, including the concentration of CO2, phosphate, nitrate, chlorophyll and their interactions. “We want to understand El Niño in its entire complexity: in the water, in the atmosphere and at the water surface, the interface where the gas exchange takes place,” Haug explains.
During El Niño’s peak, water temperatures in the eastern Pacific approached record highs. At the same time, the Amazon basin and northern Brazil experienced a severe drought while regions in India saw the thermostat rise to fifty-two degrees Celsius. During the summer El Niño subsided, as expected, and the water temperatures in the tropical eastern Pacific plummeted by nearly ten degrees Celsius in some places. Ralf Schiebel—head of research on the Seibold and group leader at the Department of Climate Geochemistry led by Gerald Haug at the Max Planck Institute for Chemistry in Mainz—emphasises that this is indeed a huge temperature difference.
For the first time, complete datasets on the oscillation between El Niño and La Niña have now been collected. Director Gerald Haug is very satisfied with the work, saying, “We have all the data we wanted.”
Have they already identified any trends? Both Haug and Schiebel demur. “It takes three to four years to analyse a complete dataset,” as Schiebel says. The measurement data must first be cleansed and quality controls conducted. In addition, the data gathered in the air and water samples have to be correlated. This step is critical, as there are numerous interactions, feedback loops and interdependencies between the ocean, the Earth’s crust and the atmosphere. As an example, Schiebel refers to CO2 measurements, saying, “the Galapagos Islands have active volcanoes, and natural outgassing can lead to locally higher CO2 concentrations. We have to factor this out of the high CO2 values we measured.”
The researchers must also always adjust for temperature, salinity and air pressure when interpreting CO2 levels. More CO2 is dissolved in the ocean’s surface water when the water is colder and less salty, and when the atmosphere’s CO2 pressure is higher. “That’s why calculating CO2 measurements without data on temperature makes no sense,” Schiebel says.
The researchers measure the water temperatures with an accuracy in the thousandths—because it’s normally only the upper water layers that are warmed by the sun and air, whereas at depths of about two hundred metres and lower, the water temperature should remain consistently cold. Schiebel explains that, if deeper water in the Pacific is just a few hundredths of a degree Celsius warmer, it means “a whole lot of energy was involved”. This energy is apparently being pumped into the system by human-caused global warming, and Schiebel shares an uncomfortable truth: “The ocean is now already significantly warmer at depths of two thousand metres.”
More energy in the system has various effects, including an increasing likelihood of tropical storms. High winds, for their part, accelerate other processes in the world’s oceans. “This generates feedback loops that are difficult to fully grasp,” Gerald Haug says. The researchers believe the comprehensive data collected in the coming years will lay the basis for a deeper understanding of the world’s oceans in the age of global warming.